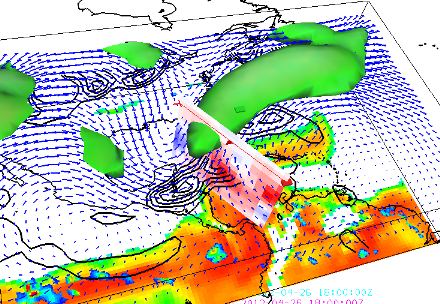
 early season rains April 2012: jet streak, vertical velocity, 200 and 850hPa wind vectors, total precipitable water, 500hPa positive temperature advection, and TRMM precipitation
Do you spend 90% of your time trying to code and only 10% doing real science? I used to also before embracing the IDV! Now I spend 100% of my time doing real science and 0% banging my head on a command line terminal. Thank you IDV!
Download the IDV here
Watch Brian Mapes' handy IDV youtube tutorials
Download the Brian Mapes IDV extensions here.
Download the IDV here
Watch Brian Mapes' handy IDV youtube tutorials
Download the Brian Mapes IDV extensions here.
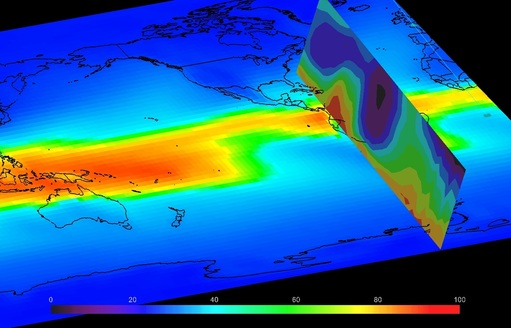 TPW (2D shaded view) and RH% (vertical cross section) visualized in IDV.
Easy and intuitive plotting in IDV.
download IDV demo files below
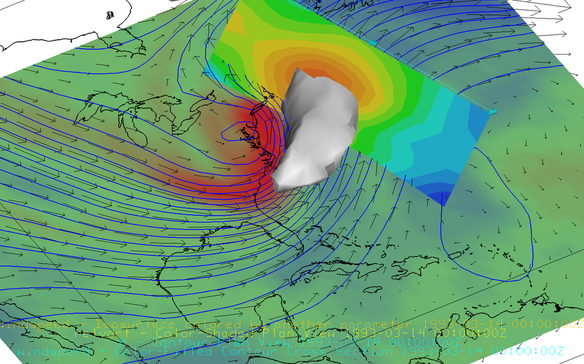
Download the IDV .zidv bundle for a demonstration of wind visualizations from the 1993 Storm of the Century (UWI-Cave Hill Synoptic Meteorology II class). Click image above to download file.
Below are files to help explore the IDV. Download by clicking on the "HERE" link below.
Click HERE to download single level parameters for IDV tutorial
Click HERE to download vertical level parameters for IDV tutorial
Watch this VIDEO on how to download and plot ERA5 reanalysis data for the IDV
Click HERE to download vertical level parameters for IDV tutorial
Watch this VIDEO on how to download and plot ERA5 reanalysis data for the IDV
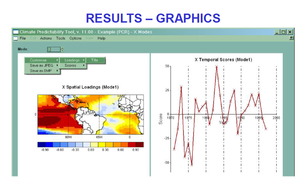
Download and explore the Climate Predictability Tool (CPT) from the IRI to produce statistical seasonal forecasts.
A list of my often used handy climate analysis web tools:
The IRI Data Library
NOAA Physical Science Division Plotting and Analysis Tool
NASA Giovanni
The IRI Data Library
NOAA Physical Science Division Plotting and Analysis Tool
NASA Giovanni
UWI METE1305 Spring 2024
Introduction to Climate Change and Society (click for course outline)
NOTE - slides posted below are just a guide and do not substitute for class lecture and discussion
CLASS 1 - general circulation of the atmosphere
CLASS 2 - general circulation of the oceans
lab 1 - mapping sea surface temperature monthly and seasonal climatology
CLASS 3 - ocean circulation continued followed by sources of natural climate variability
lab 2 - mapping sea surface temperature differences
CLASS 4 - natural climate variability
anthropogenic climate variability
lab 3 - ENSO
CLASS 5 - anthropogenic continued
lab 4 - mapping seasonal correlation
CLASS 6 - corals and climate change
CLASS 7 - IPCC and CMIP
lab 5 - future rainfall projections
CLASS 8 - Stakeholders